
Recent geopolitical tensions involving the United States and Iran, and threats to the Strait of Hormuz, which normally carries roughly 20% of global seaborne oil trade, sparked widespread predictions that oil prices would surge toward $200 per barrel. Brent crude did spike, topping out near $116 earlier this year amid the disruptions, but the apocalyptic scenario never materialized. Prices have since moderated, with Brent trading around $77–78 per barrel as of early July 2026.
Two timely analyses on X captured the immediate reasons why the market held together far better than feared.
In a detailed post, @MarioNawfalhighlighted how buyers and sellers adapted rapidly. Major importers like China, Japan, and South Korea drew down pre-positioned stockpiles. Weaker demand in poorer nations led to what economists call “demand destruction.” On the supply side, the United States stepped up dramatically: crude exports surged from under 1 million barrels per day (bpd) this time last year to nearly 5 million bpd (with a record 5.6 million bpd in May 2026). This private-sector response — companies pumping harder and drawing commercial inventories — dwarfed releases from the U.S. Strategic Petroleum Reserve (SPR) and helped stabilize prices.
Energy analyst @anasalhajji noted another key dynamic: the U.S. reimposition of restrictions on Iranian oil exports came after China had already secured over 50 million barrels of Iranian crude and the market gained access to 60+ million barrels of previously stranded supply. This effectively eased short-term tightness through classic energy politics and market rerouting.
These short-term adjustments worked because global oil markets remain remarkably flexible when prices signal scarcity. But the deeper story lies in the longer-term fundamentals that prevented a true doomsday while setting the stage for structural strength ahead.
A Longer View of Oil Prices
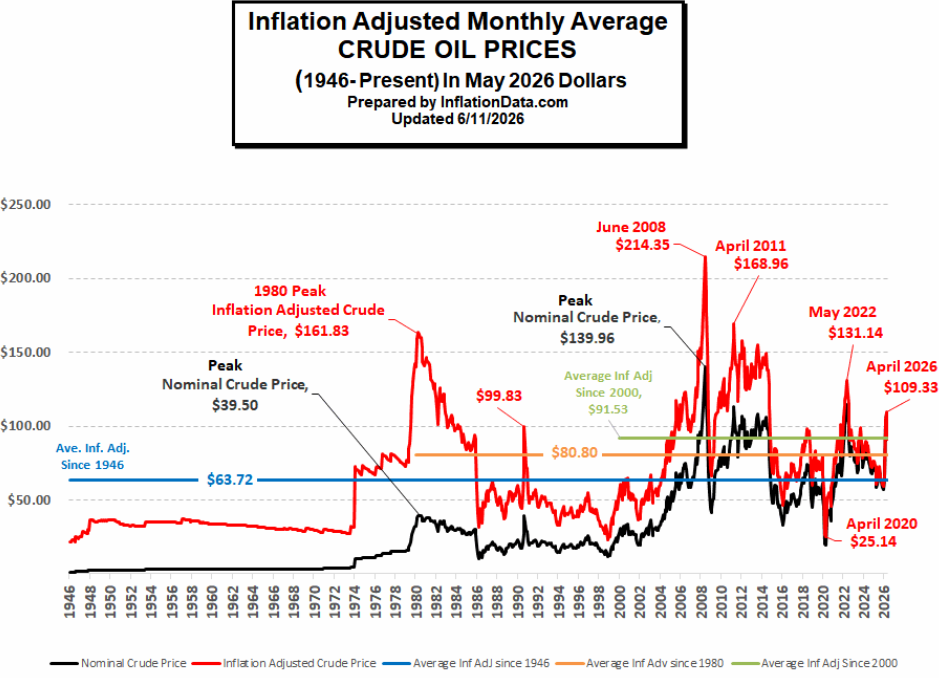
Oil prices have always been volatile, driven by geopolitics, supply shocks, and demand cycles. Inflation-adjusted charts show major peaks in the late 1970s/early 1980s, 2008 (over $200 in today’s dollars), 2011–2014, and 2022 (around $130+). Recent spikes fit the pattern, but the current moderation reflects both immediate supply responses and the fact that the world entered this period with some buffers already in place.
What stands out in the longer view is the persistent underinvestment in upstream oil and gas. According to veteran investor Rick Rule, the global industry has been underinvesting in sustaining capital expenditures to the tune of over $1 billion per day for several years already — and is likely to continue doing so into 2026–2027. This chronic shortfall compounds natural field declines and rising demand from developing economies.
International Energy Forum (IEF) and S&P Global analyses have repeatedly quantified the gap: cumulative upstream investment needs of roughly $4.3–4.9 trillion between now and 2030 (with longer-term OPEC estimates reaching $12–15 trillion by 2045–2050) to maintain supply and meet projected demand growth to ~110 million bpd. Actual spending has lagged, especially post-2014 and during the energy transition focus of the early 2020s.
The Critical Role of U.S. Domestic Oil and Gas Development
America’s shale revolution and subsequent production surge have transformed the global picture. U.S. crude output has repeatedly hit record levels around 13.2–13.6 million bpd in recent periods, making the United States the world’s top producer and, at times in 2026, the top exporter of crude and petroleum products combined (reaching ~10.5 million bpd total exports in peak months).
This domestic strength is not just about volume — it delivers energy security, hundreds of thousands of high-paying jobs, significant tax revenue, and a reliable supply source outside traditional chokepoints or geopolitically risky regions. When global disruptions hit, U.S. producers and exporters can respond quickly because of flexible shale operations, existing infrastructure, and a market-driven culture. The surge in exports during the recent tensions directly offset losses elsewhere and demonstrated why continued domestic development matters for both American prosperity and global stability.
Shifting Away from Traditional Chokepoints
The global market is already adapting by reducing reliance on single points of failure like the Strait of Hormuz. Saudi Arabia’s East-West pipeline has run at elevated capacity (reportedly up to 7 million bpd in periods), routing oil to the Red Sea. The UAE’s Habshan–Fujairah pipeline delivers significant volumes to the Gulf of Oman. Other bypass options, new terminals, and expanded pipelines in the region are either operational or advancing.
Broader diversification includes increased U.S. exports reaching Asian and European buyers directly, growth in LNG trade (which has different routing flexibility), and long-term shifts toward more resilient supply chains. The recent crisis accelerated these trends: rerouting happened faster than many expected, and investments in alternatives are likely to accelerate.SPRs, Commercial Buffers, and New Strategic Builds
The U.S. SPR has been drawn down significantly amid the tensions, reaching approximately 319–325 million barrels by early July 2026 — its lowest level since 1983.
NinePoint has an excellent chart, and notice the yellow “We are Here”.
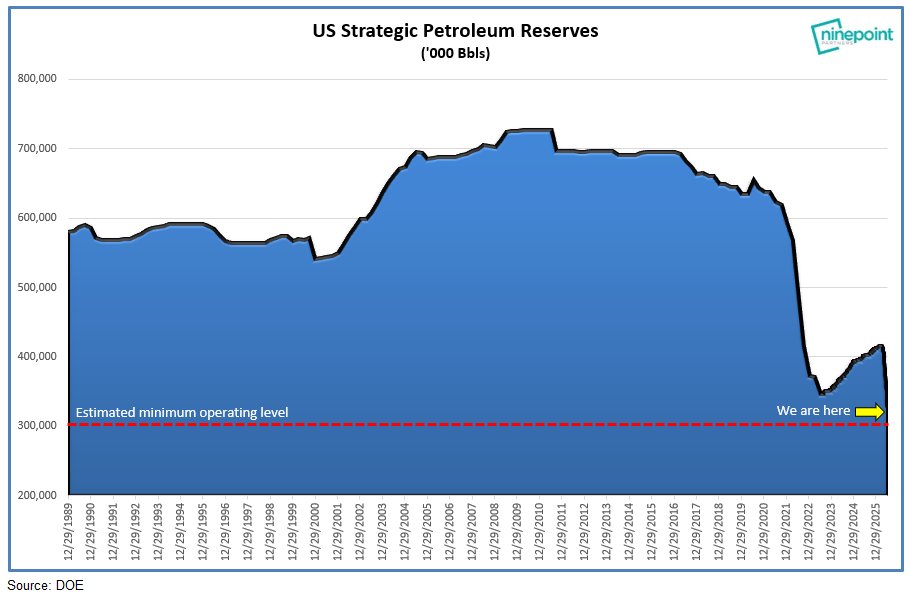
Releases helped cushion the market, but they were secondary to private-sector and commercial inventory draws.
Globally, buffers proved far larger than many realized. China holds the world’s largest strategic and commercial stockpiles, estimated at nearly 1.4 billion barrels (including directed builds by national oil companies), which provide substantial absorption capacity. Other nations and commercial players also drew from inventories.
Looking ahead, new and expanded buffer capacity is being built or planned. India is expanding its SPR facilities and considering additional strategic storage. Other countries are racing to strengthen reserves in the wake of the disruptions. These new buffers, combined with eventual refilling of drawn-down reserves (a multi-year process), will add meaningful resilience to the system over time.
A New Energy Run for Oil and Gas in the Long Term
The failure of the $200 doomsday scenario does not signal weak fundamentals — it highlights market adaptability and the value of diversified, responsive supply (led by U.S. domestic production). However, the underlying math remains bullish for oil and gas prices and investment over the medium to long term:Chronic underinvestment ($1B+/day shortfall) meets ongoing field declines and resilient demand growth.
- Geopolitical lessons reinforce the premium on secure, flexible supply sources like U.S. shale and expanded bypass infrastructure.
- New global strategic and commercial buffers will provide better shock absorption, but cannot replace the need for sustained upstream investment.
- U.S. domestic development continues to deliver both economic benefits at home and a stabilizing supply abroad.
The quiet machinery that prevented catastrophe — surging U.S. exports, stock draws, demand responses, and pipeline rerouting — bought time. But that time should be used to recognize that oil and gas remain essential, and the structural supply challenges point to a new, more durable energy bull market ahead. Continued responsible development of America’s resources, paired with global investment catch-up, will be central to meeting future needs without repeated price spikes.
The doomsday price stayed away this time. The reasons why — and what they imply for the years ahead — make a compelling case for optimism about the long-term prospects of oil and gas. The cool thing about working in Texas is that we are part of the solution, delivering lower-cost energy to the U.S. Market.
Appendix: Sources and Links
- Mario Nawfal X post (July 9, 2026): https://x.com/MarioNawfal/status/2075056095245062254
- Anas Alhajji X post (July 9, 2026): https://x.com/anasalhajji/status/2075189139117338673
- Rick Rule on $1 billion/day underinvestment (various 2026 interviews/podcasts, e.g., Kitco Mining discussions).
- IEF/S&P Global Upstream Oil and Gas Investment Outlook reports (2023–2024 editions and updates).
- EIA data on U.S. crude production, exports, and SPR inventory (eia.gov).
- Reuters reporting on U.S. crude export records (May/June 2026).
- EIA and other analyses on world oil transit chokepoints and bypass pipelines.
- Trading Economics/market data on current Brent and WTI prices (~$77–78/bbl range as of July 9, 2026).
- Macrotrends and Statista historical oil price charts.
- Reports on China and India SPR builds/expansions (EIA Today in Energy, Reuters, Economic Times).
All facts drawn from publicly available data as of July 2026. Energy markets evolve quickly; readers should consult the latest reports from the EIA, IEA, and companies for updates.